The tool delivers statistics data based on a simplistic design.
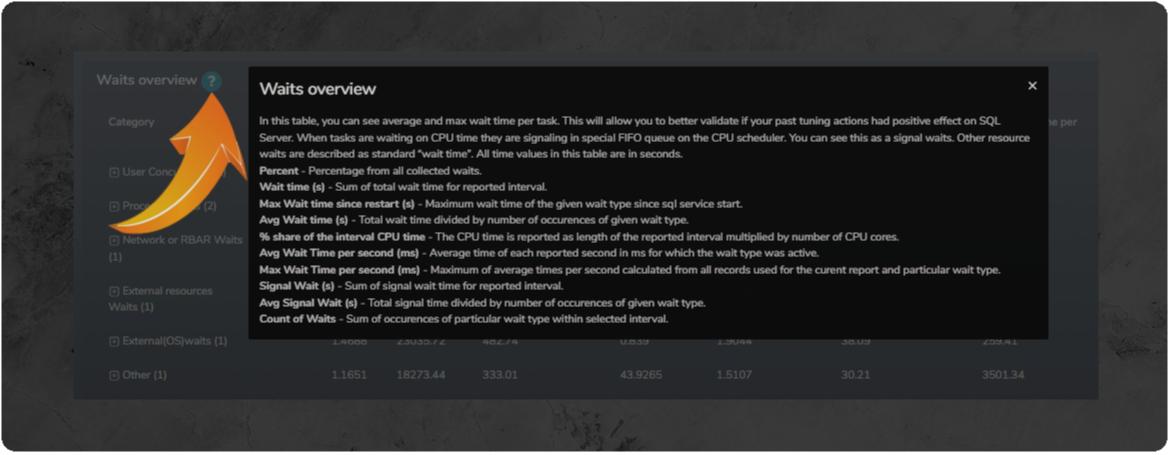
Every graph or table has a description button where the reader can learn how to interpret data.
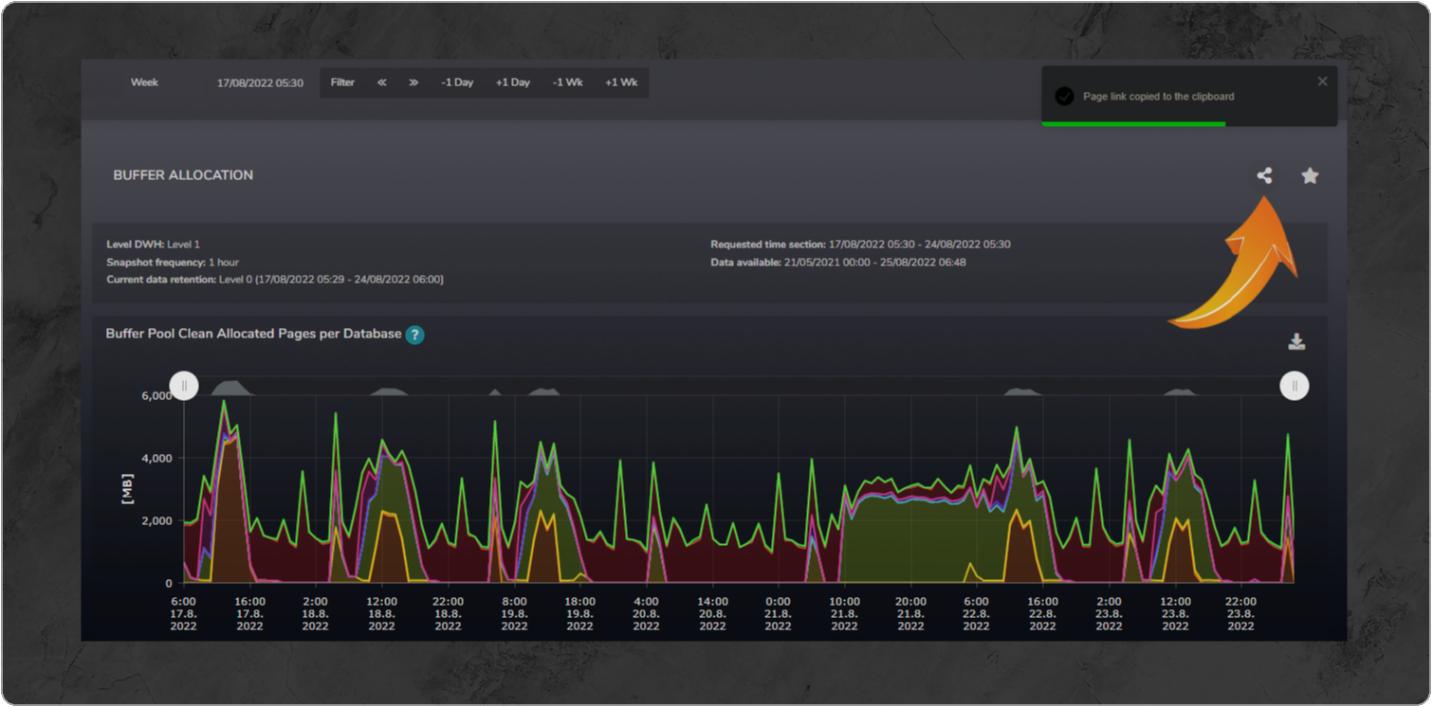
Report pages contain share buttons to distribute your view to your teammates easily.
Using quick find, you never miss a metric you are interested in.

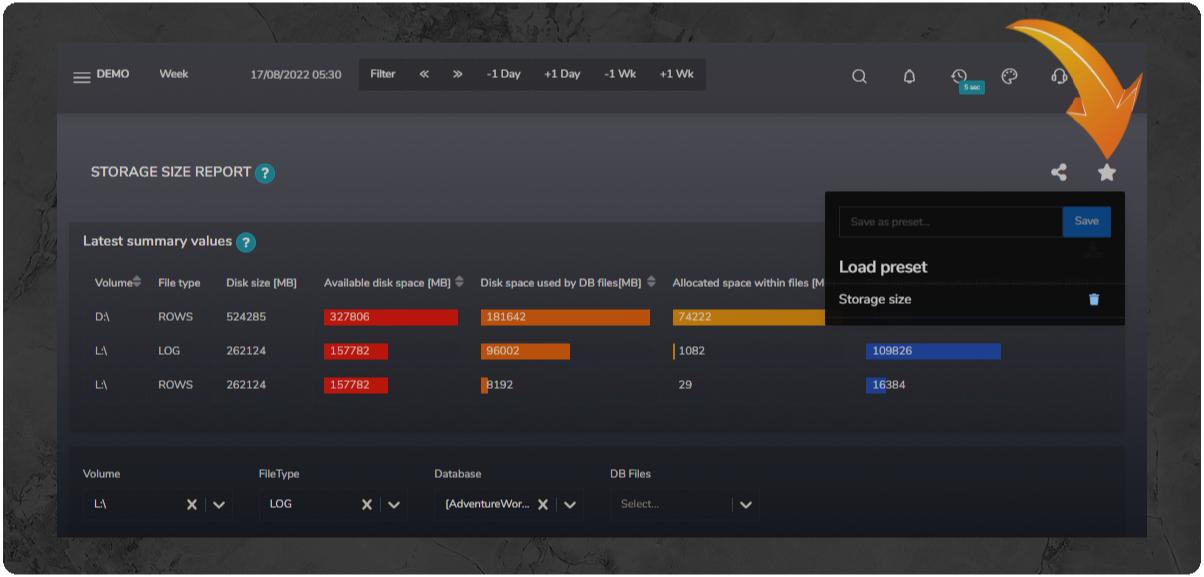
Save your favorite report filters into presets and automatically use them on any monitored instances.