"Help people get complex data on SQL Server easily and understandably"
SMT Mission


Overview
- SQL Monitoring & Performance Tuning tool designed by (in the field) performance tuners developed in-house for administrators, developers, and tuners
- Running in 24/7 always-on mode
- Accessible by the Customer internal team and Woodler team (optional)
- Handy in the development/testing phase of the applications
- Perfect for root cause analysis (RCA)
- Automated alerting and notification
- Heart of SQL Server administration
- Custom reports connecting different metrics into singular reports for better troubleshooting overview
- Strongly recommended using during the deep-dive tuning phase
- Enables you to compare and measure the impact of future changes and optimizations to the system
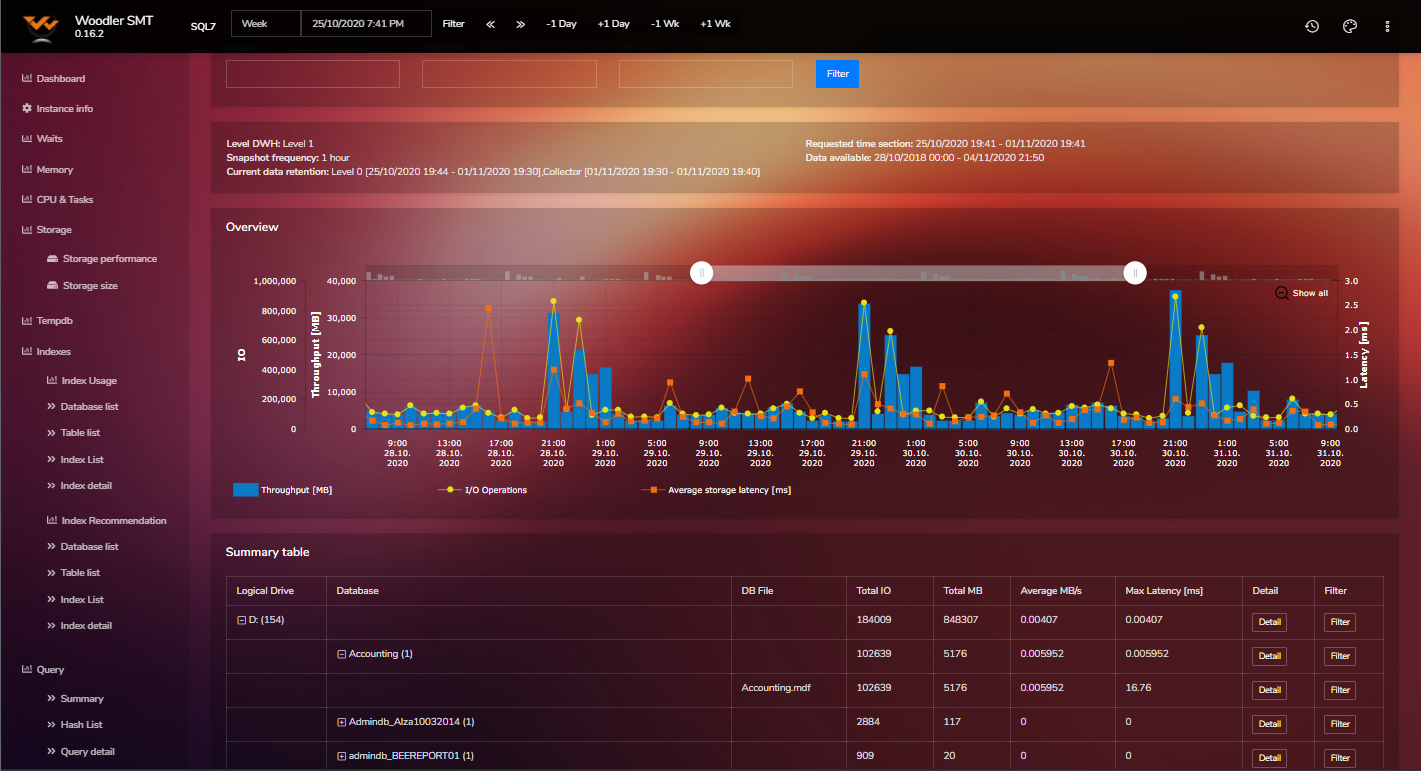
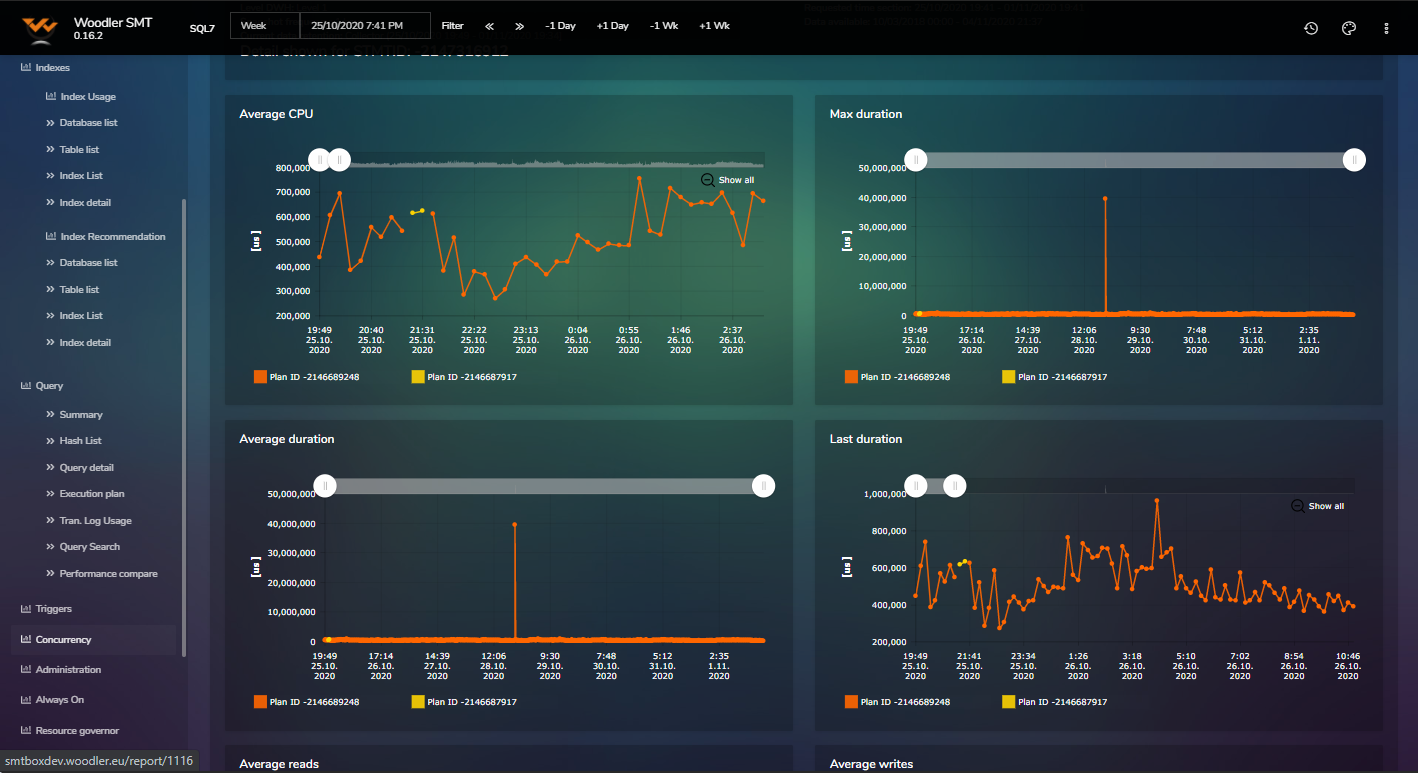
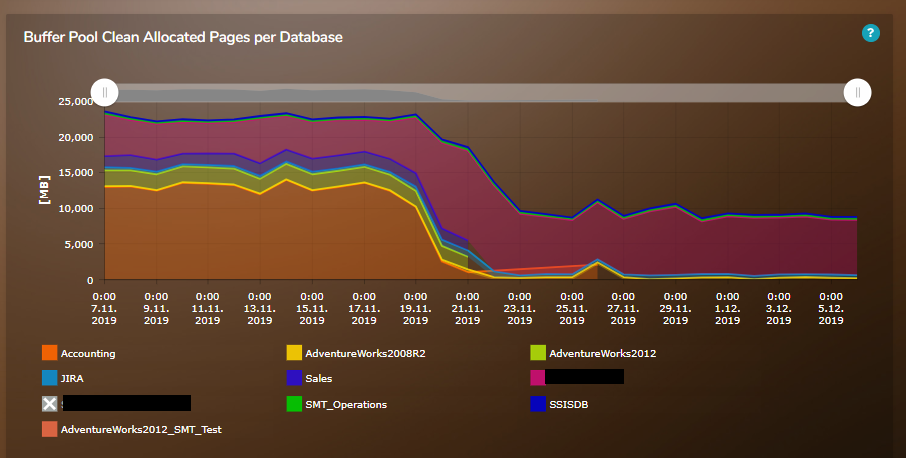
Examples of SMT Reports
The tool currently holds 55 reports and many more are in the development pipeline.
Do you want a free trial? Let´s hold an online meeting
Online meeting
- Proper SQL Server configuration
- Index consolidation: to speedup database modification operations and maintenance
- Reconfiguration of index objects: to provide a more concurrent environment and less fragmented database(s)
- Optimize database transaction logs: to speed up transaction processing
- Leveraging the baseline monitoring we can:
- Recommend new indexes to improve the overall performance of queries executed on the server
- Perform query tuning for top intensive/resource consuming operations on the server
- Feature tuning for user's most-application-exposed operations
- Recommend database code refactor if possible (depending on database and application type)
- Further tuning of database maintenance operations based on historic runtime data
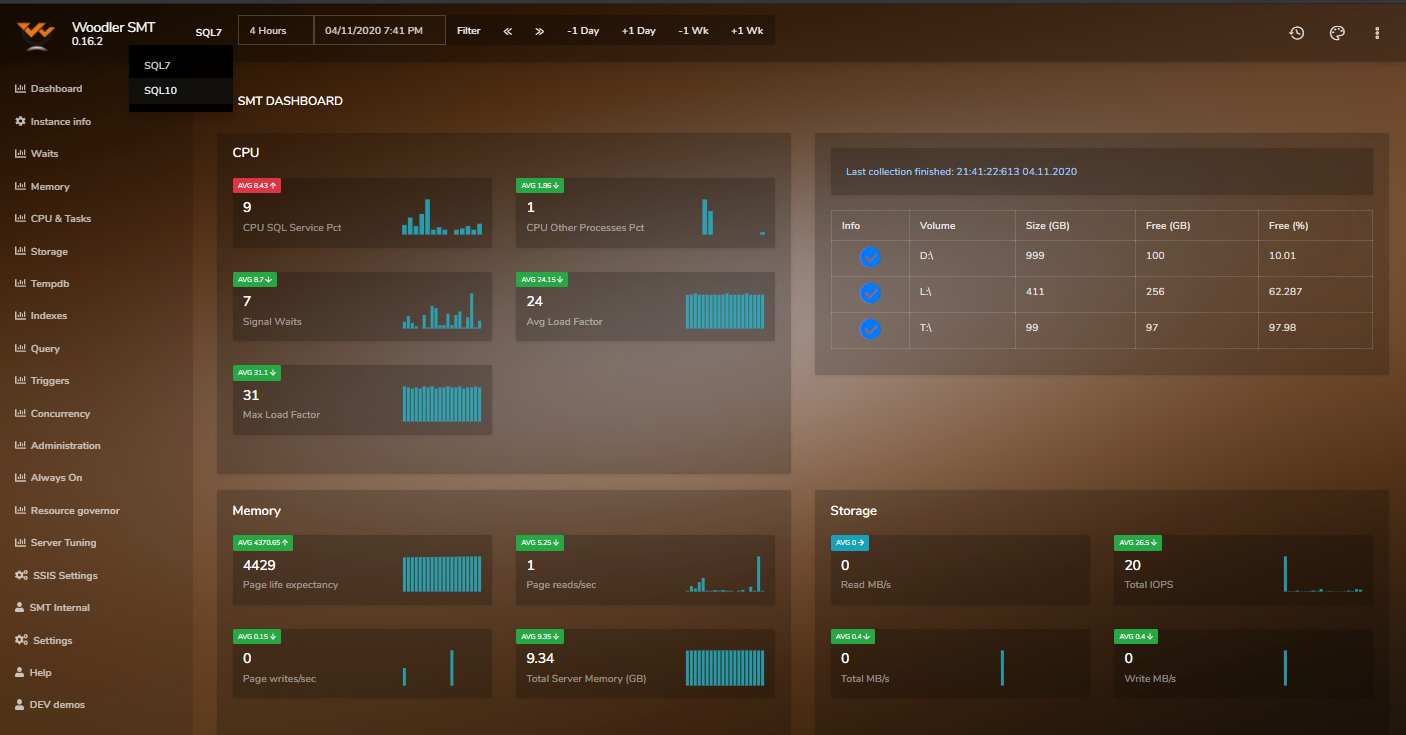
Areas covered by our monitoring tool:
- Memory allocation distribution, usage, and its KPI states.
- CPU resource allocation per database or process and related counters.
- Tempdb performance metrics and usage, together with contention points and costly operations.
- Very detailed storage usage statistic collection re: specific database file by volume.
- Transaction log usage per-database and file with its contention points and costly operations.
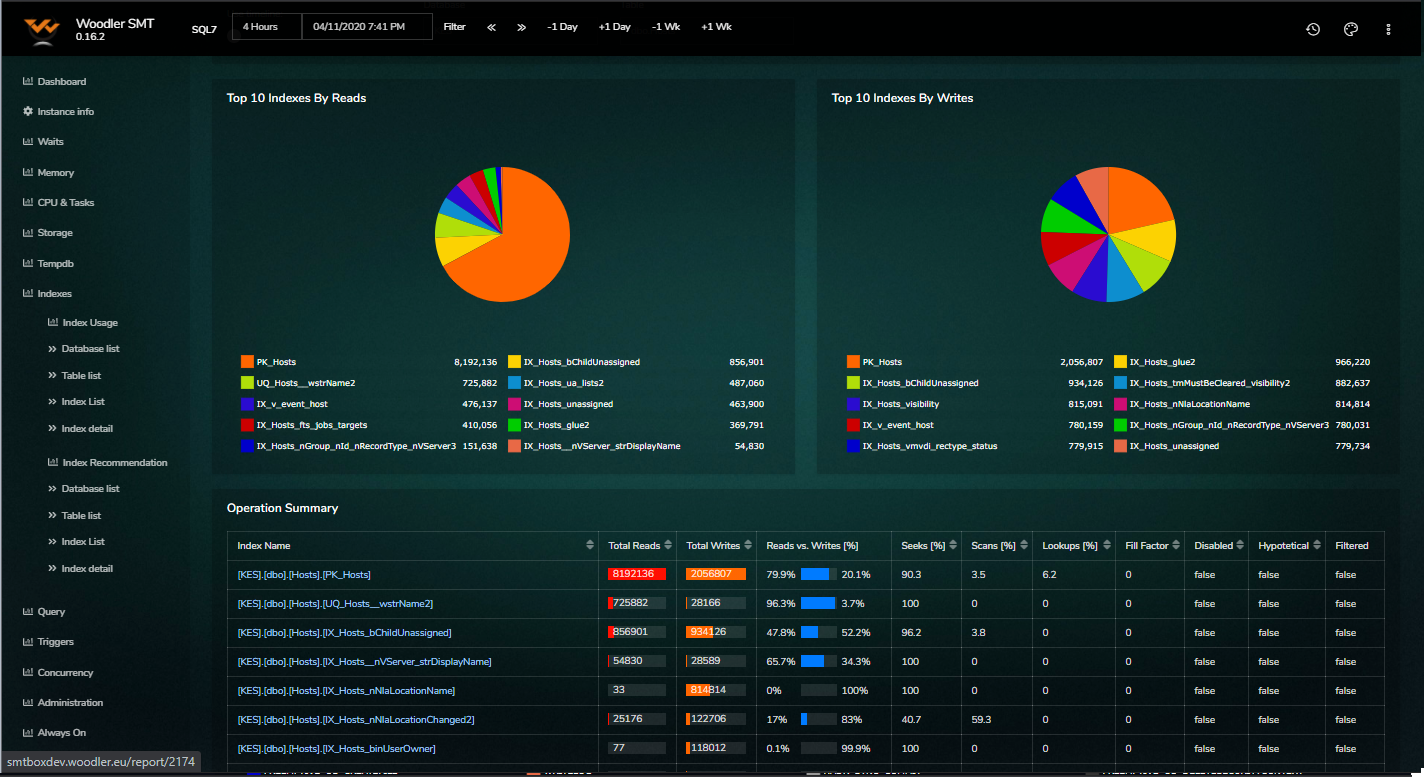
- Index usage of all indexes on the server and its design changes together with recommendations over time.
- Query performance for most interesting operations on the server and databases.
- Blocking and deadlocking operations on the server and its victims.
- All resource governor usage and configuration statistics with up to workload group detail.
- AlwaysOn events and configuration.
- Server configuration changes and all its logs such as server, agent, SMT alerts, maintenance, and job automatization.
- Performance tuning activities over time with its impact.
- Everything was collected and stored up to 3 years in the past for good trend analysis.
- With schedules configurable per monitoring item with server-specific presets.
What we monitor/feature above and beyond other industry-standard tools:
- Full Resource Governor metrics
- Per database file performance and capacity
- Index recommendations with overtime statistics
- Per database index usage metrics with overtime statistics
- Tuning notes, (diary & impact analysis report/dashboard)
- Job runtime volatility report
- Query compare analyzer between two specified time windows
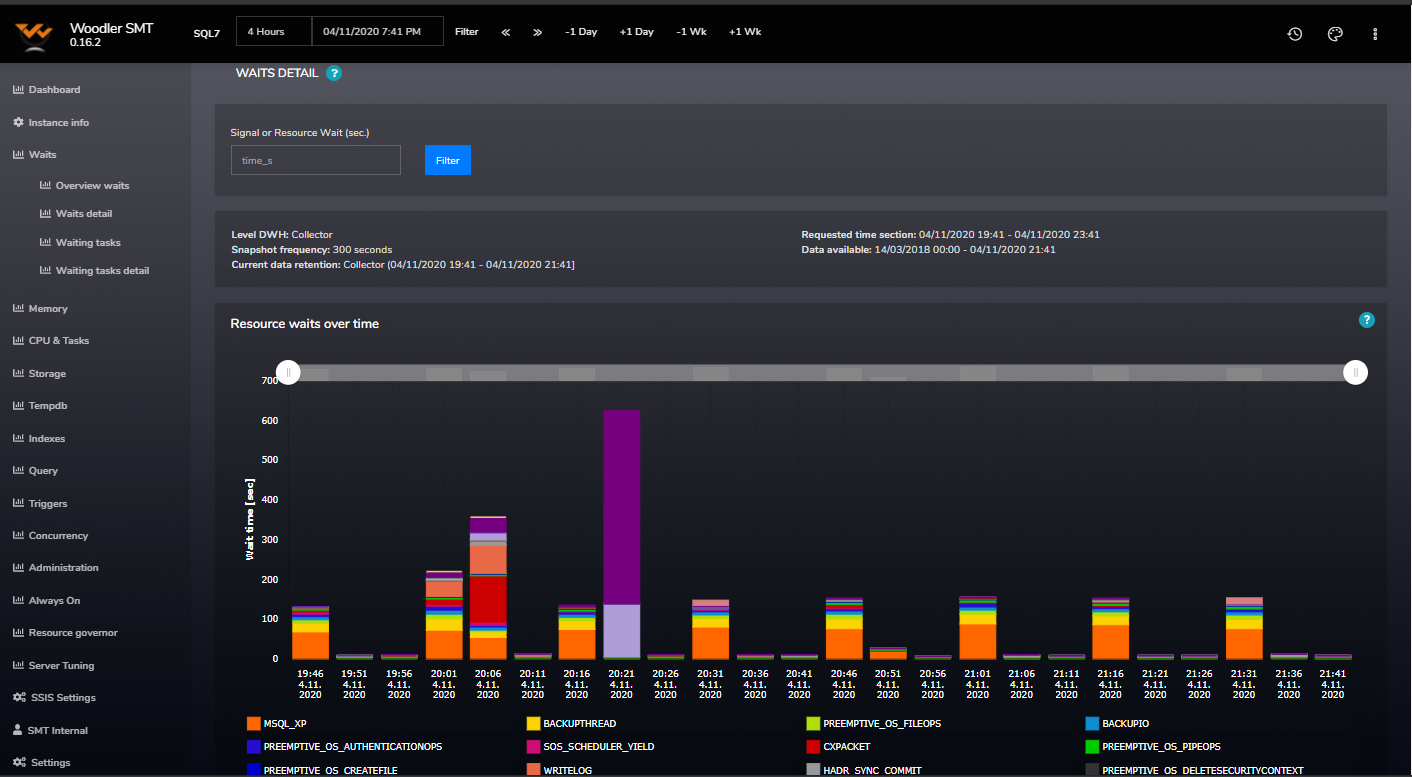
- Collector for Waits, Spinlocks, Latches with overtime statistics
- Memory allocation with per database granularity for reading and write pages
- Per NUMA node metrics for memory
- Tempdb allocation patterns (All type of stores, cleanup rates, and contention events)
- Memory checkpoint and lazy writer processes with overtime statistics
- Audit for changes of server config and database index definitions
- Advanced CPU counters and waiting tasks
- Automated memory management and cleanup
- Automated & offloaded backup testing and consistency checks for all company SQL servers
- Automated synchronization of logins between AlwaysOn Replicas
- Build-in selectivity calculator for table columns with graphical histogram
- Super-fast front end interaction with API connectivity at your disposal
Possible Monitoring Implementations
- Standalone SQL Server installed on a physical host or virtual machine using one SMT License
- Failover Cluster Instance of SQL Server using one SMT License
- SQL Server (Active Node) connected through Availability Groups with other SQL Server (Passive Node) using one SMT License
- SQL Server (Active Node) connected through Availability Groups with other SQL Server (Active Node) using two SMT Licenses
- SQL Server Azure Managed Instance using one SMT License (further costs may apply due to need for VM for application to frontend or Azure Data Factory or SQL Web edition instance)
Will you need an SMT?
You may ask the following questions regarding your current SQL Server environment and situation: If you are in doubt about current solutions, there is a high probability this tool will help.
- How are you notified regarding critical issues on core company SQL Servers?
- Which communication channel does your team use to get notified?
- Is the response time from your team good enough?
- Are there any delays in resolving problems case by case?
- If any issues arose on your SQL Servers, did your dba team described the root cause of the issue?
- Is the root cause described based on real monitored / collected data or it is just an assumption from a dba team?
- Are there any recommendations set after the root cause has been identified to prevent the reoccurrence of the issue?
- After implementation, how has the new state of the server been evaluated?
- Was any hard data comparison or A-B analysis carried out?
- If your team makes a change on SQL Servers, how is it documented?
- Do we have a server change notebook or tuning notebook to describe what has been updated?
- Do you have a tool to measure the trend change of your SQL Server wait statistics?
- Are you monitoring the performance of your top queries running on the server over time?
- How long do you keep your collection history? Which query attributes are you collecting (execution plans, duration, physical reads)?
- Are you monitoring and auditing server-wide configuration changes?
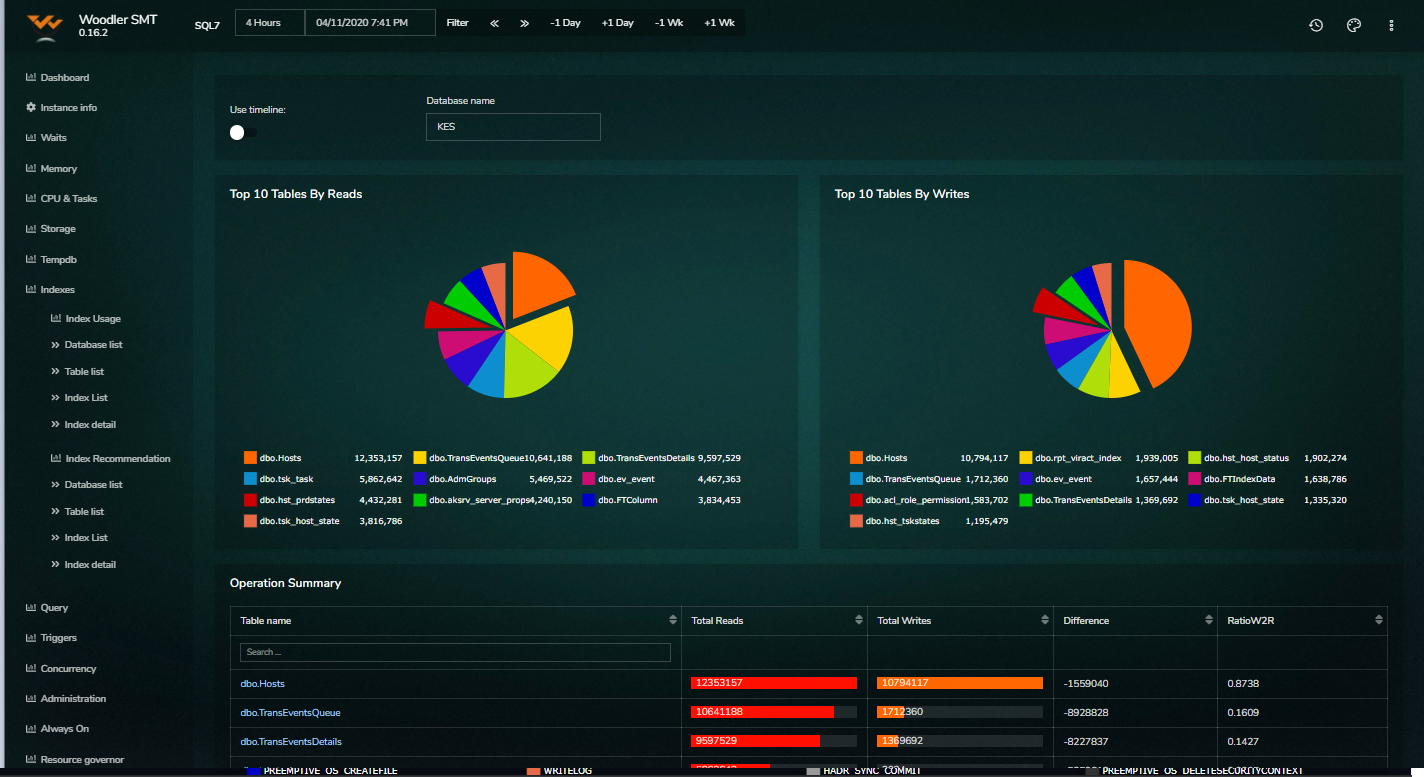
- Are you monitoring database, table, and index usage?
- Would you like to know where your SQL Server sees the opportunity to add or update the index on the most important tables?
- Do you know which tables are most exposed to reads and writes?
- If you find slow performance of your storage, are you able to identify which queries used it during a poor performance state?
- How you currently identify query performance regressions?
- Are you able to describe if your application is bloated by parameter sniffing situations?
- Do you have any deadlock monitoring in place?
- Do you know which currently existing indexes are not needed on your tables?
- Can you describe which indexes on your core database are mostly fragmented during the day?
- Are you somehow recording changes on your existing indexes?
- Do you maintain records regarding your query/index tuning activities with an impact on existing queries?
How SMT Works
The Alert module of SMT monitoring together with standard SQL Server alerting provide notification about upcoming issues.
(via mail and incident ticket registered in our help desk tool to provide you with an overview of the situation and our future activities). Alerts are also available on the SMT tool dashboard as an overview
Via early notification, we provide the support you need in the time you need it.
Thanks to our tailor-made monitoring tool we can easily identify the root cause and provide proper recommendations to fix the issue.
As a result, this service saves cost on both the business and support side.
Decreased out of business times for core company servers and applications plus less time spent on troubleshooting and analysis of issues on the support side.