Good day SMT users,
It has been a while and another version of SMT (SQL Monitoring & Performance Tuning) about to be released. Just writing the post made me realize how many changes did we deliver so I hope it justifies the last time since you were exploring changes in 1.5.
The new version is 1.6 and includes the following.
SMT frontend changes
- SMT now contains introductions of basics, all menu items, and SMT settings, these will be shown only once to new users and then can be run manually anytime you want. Menu items automatically show a hint to help you to navigate through the data available in SMT.
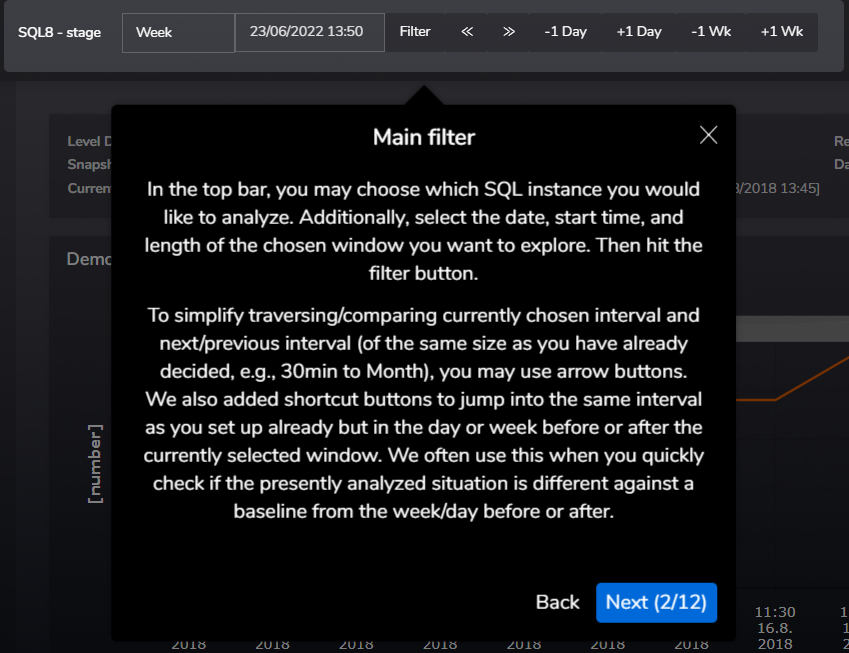
Figure 1: screen of introduction in SMT
- SMT contains now a search feature, so you can find a report with data that you are after faster.
- You can schedule a support session directly from SMT this is going to be used mostly by our SMT partner licence users.
- New buttons to share a link to your report including your filters and creating your own bookmark were added.
- Using bookmarks you can create your own list of favourite configuration of the main and on-page filters for a particular report e.g.: wait report only showing cpu related wait types. Please be aware that changes to charts or tables on the report page like hiding specific graph or change sorting of the table are not reflected in your bookmarks. Bookmarks are not instance specific.
- Share button makes easier for you to share your report view with your colleagues or support team. The generated link that is copied to your clipboard contains all current parameters of your view like instance, selected date and time and on-page filters.
.png)
Figure 2: New SMT features
- SMT allows you to download data that were provided by API to frontend, so you can use them in Excel spreadsheet if you want to do some quick check of something that is not obvious from the related chart or table. Note: for paged tables only the visible data are downloaded.
.png)
Figure 3: New data download button
- SMT has now a new way how to handle “Now” choice in the time filter. The now stays “Now” in the app and is always translated to the client’s current time at a moment of requestion fresh data. Also, SMT deducts your choice of interval from “Now”, which should allow you to always see current data. Let me explain this on a short example: Your current time is 2022-06-30 9:15, your interval is 4 hours, if you choose “Now” data from 2022-06-30 5:15 to 9:15 will be requested and shown in your reports, where applicable.
REPORTS
- New more advanced and user-friendlier Query compare report.
- Query store – a new set of views on data available for DBs where query store is enabled and can provide another level of information or different view on data.
- Index definition collection is now configurable for a particular hour and could run multiple times a day. See “IndexDefHrs” parameter in SMT settings menu category.
- Index details - on the backend we have added new columns like OptimizeForSequentialKey, AutoCreated, IsUniqueContraint, and a few others to be able to provide you with complete information about each index used at your server. Please be aware that the initial load of these new fields will lead to records visible in Index Design changes report.
- Index operations data have now a DWH tables (longer history) available for timeline values.
- Redesign of Index details
- new tabs with overtime operations data, enhancements to sample queries, and a new view of index fragmentations.
.png)
Figure 4: Changes structure of information at index detail
- Blocking chains - we have added more information for your conveniences like locks and more details about each session. The visualization of chains changed slightly as well.
- Blocks collections do now decode blocked object during the collection, previously SMT has done it at a moment of reporting.
- Tools
- we have added new tabs to Current activity report: Current blockers and Current index processing.
- DB files distribution – use it to see how multiple files per DB are used
- Overview of highly fragmented indexes – we use the log table of Ola’s maintenance so you can see when Index is maintained perhaps too late.
- You can now try to find details about a specific session from a particular time, we utilize data that we have been already collecting for Concurrency reporting so no additional workload for collection to provide you this information.
- The overview of alerts was made better to read.
- Minor release (already prior 1.6) made it possible to configure a location of the Ola’s log table that SMT can read and aggregate data for a Maintenance report, which has been enhanced as well for better filtering options. Look for “OlaTableLOC” parameter if you need to.
INTERNAL
- SMT DB internal self-maintenance solution.
- Bug fixes & improvements to current features.
- A bunch of changes behind the scenes allow the above-listed features and enhancements.
- Changes and updates of libraries in SMT API to error handling and reporting.
- SMT frontend libraries updates.
Thank you to all our SMT users for all ideas sent to us to enhance again our SQL Monitoring & Performance Tuning. Those, which haven’t made it to this version haven’t been forgotten and are ready to be picked in the future.
Please do not hesitate to contact us with any questions.
On behalf of the whole team
Jiri Dolezalek