Dear SMT users,
It feels like a new version of SMT released shortly before Christmas to be almost a tradition. So SMT 1.5 is out and what is included? We worked pretty much on every part of SMT to make it better and more powerful.
- We now allow search through tuning messages so you can see if e.g.: index or table were an outcome of recorded tuning.
- SQL highlighting functionality was enhanced and we are now using our own branch of an open-source library.
- Better UX with charts:
- SMT can now work with multiitem filters, its initial implementation happened for the Wait report, which will allow you to select multiple waits and avoid the others if they do not concern you.
- For charts with a lot of graphs we have added “Hide all” and “Show all” feature, which will help you to select just a few graphs of your interest in much easier and faster way.
- We have added external links to wait types and latches to make the definition handy if you need it.
- SMT settings – new parameters to control how SMT behaves. Check the Parameters config to view them all.
- Collections and reporting
- New Temp DB reports to distinguish between sessions with and without version store impact, also these reports were redesigned to offer better control and visibility.
- Added columns to both index reports – recommendation and usage so you don’t have to rely on the index name only.
- New CPU per DB reporting.
- We enhanced existing compare report and have ready v2 of compare report for internal use only with an expected public release in 1.6. This will provide a lot of options how to compare two different intervals in many angles.
- Performance counters collection was changed so we keep all aggregates and with Avg now we have Min and Max available, which on the reporting side provides better view on the situation at the server at a certain point in the past.
- CPU per process on the OS level have been redone to make both collection and reporting easier.
- Optional check to collect columns statistics information for a particular database(s). View the checks at Collection settings and enable/ configure it as per instructions. This has for now only data in the database, which can be for example used for analysis around statistics updates and impact on execution plans.
- While downloading files in SMT the mime type should be now provided accordingly, which should lead to better handling of the file action particularly in Firefox browsers.
- User interface
- Table changes
- The horizontal scrollbar is now conveniently available for the whole height of the table not only at the bottom.
- Tables are using “sticky” headers so if the table is long and you scroll down you will be able to see the headers
- Dialog windows will not disappear while auto refresh is on – this was particularly valid for Current Activity and Kill session feature.
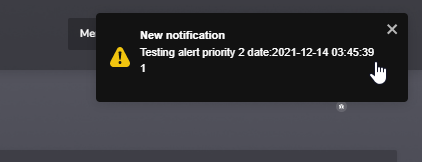
- Notifications – we have added a toast notification to make it more obvious when new alert or event is recorded, but at the same time you are able to configure this part to suit your needs.

New notification toast.

Notification settings
- Miscellaneous and internal changes
- Enhanced error logging to our centralised solution.
- Changes that allow us combining different graphs by using one chart definition.
- Store historical CPU utilization in a standardized SMT DWH way.
- Bug fixes
We wish you Merry Christmas and all good in the upcoming year. We look forward to meeting again in the SQL server and SMT universe after short brake.
On behalf of the whole dev team.
JD


