When system/application administrator reports something like “users are complaining about system being slow today” we have to figure out what is happening on the server, what has changed, why it wasn’t slow yesterday or week before.
For this type of task, we cannot dig too deep right from the start and usually after high-level analysis to make sure that there is no long process running (SMT Current activity report) causing blocks (SMT Concurrency reports) or taking too many resources we go into Waits reports category.
Let’s have a look what SMT offers in this area to analyse the behaviour of the server at a particular timeframe.
Logically following the order in the menu, we start with Waits overview where you can see the wait type categorised on the timeline. The detail always differs (same for other reports) based on the length of the interval and how recent data do you want to see.
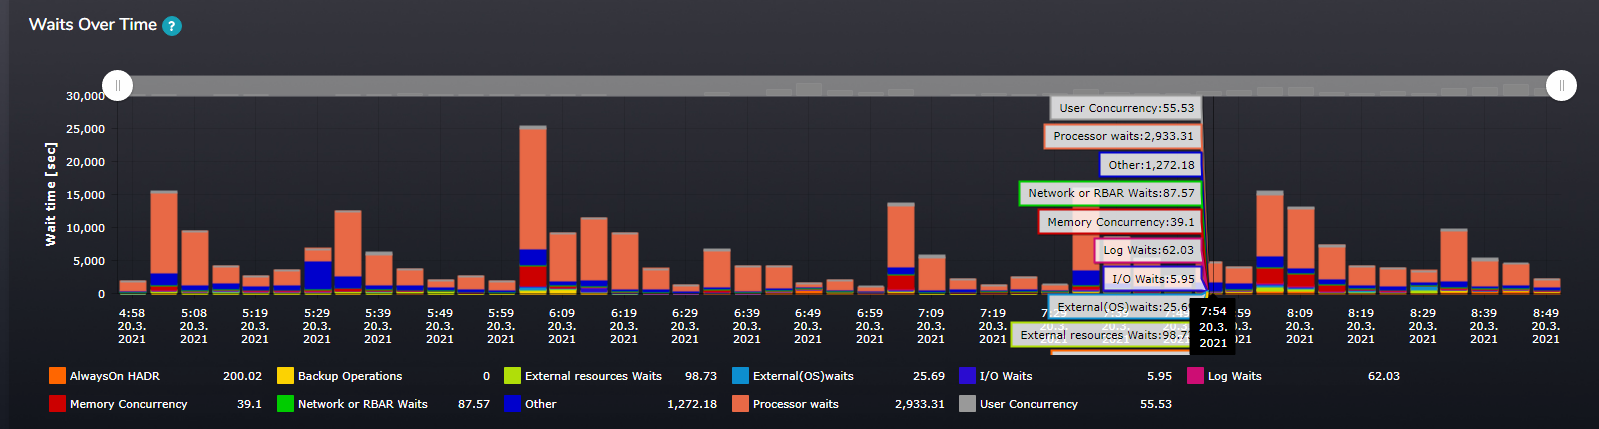
Figure 1: Wait categories distribution over the time
To provide as much information as possible on the table below we can see information aggregated for the selected interval in a tabular form. We can see figures line maximums, averages and totals per category, but also per individual wait type.
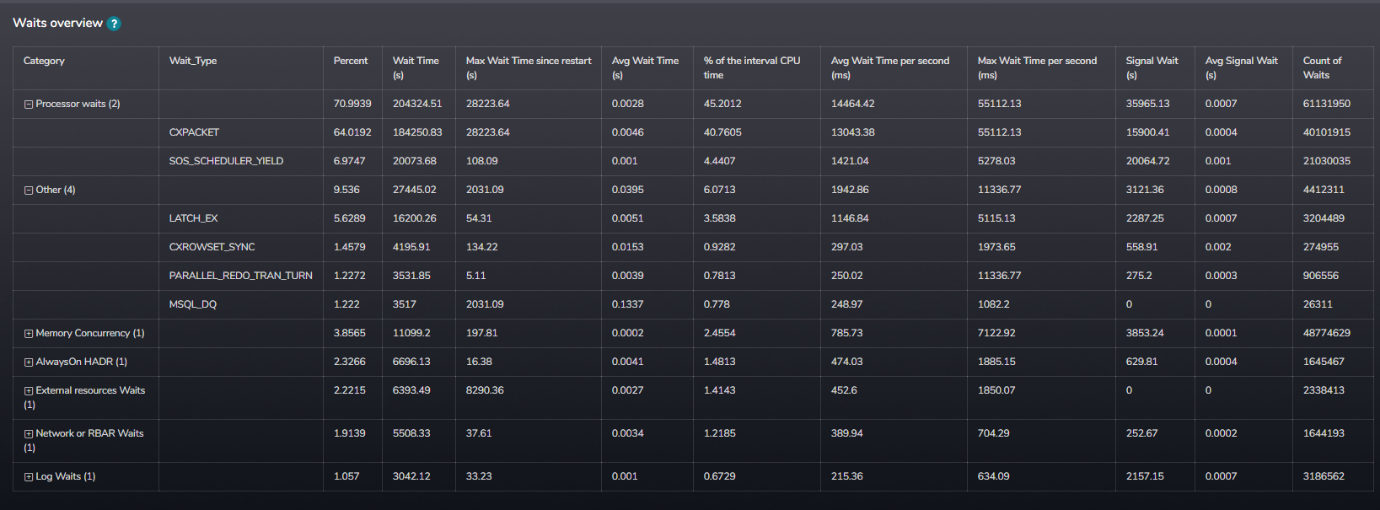
Figure 2: Waits figures in a tabular form not only per category but also per wait type
Last information provided by this report is a chart with a split between resource and signal waits, where high signal waits indicate higher CPU pressure.
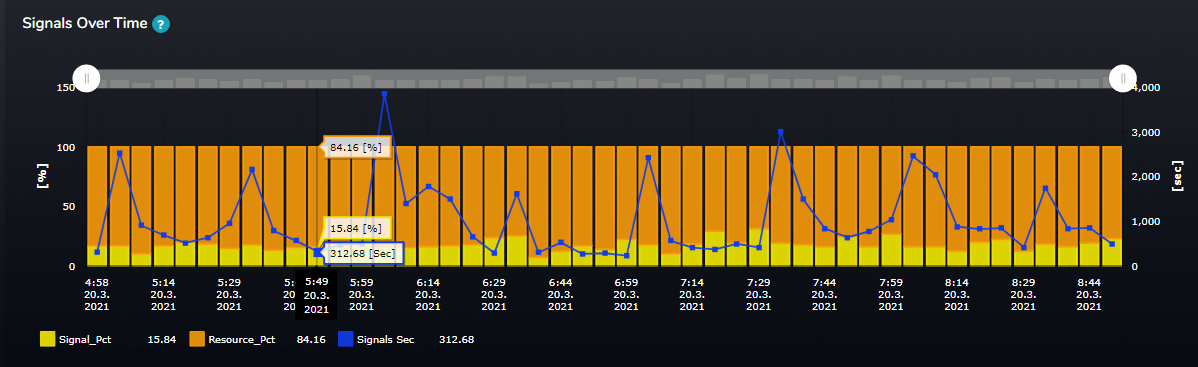
Figure 3: Split between Signal and Resource waits with and addition of Signal waits in seconds
Next report is Waits detail, which breaks the wait categories into wait types to give you more detailed information. This report shows 3 charts.
- Pie chart to compare wait types for the reported period
- Resource waits over time
- Signal waits over time
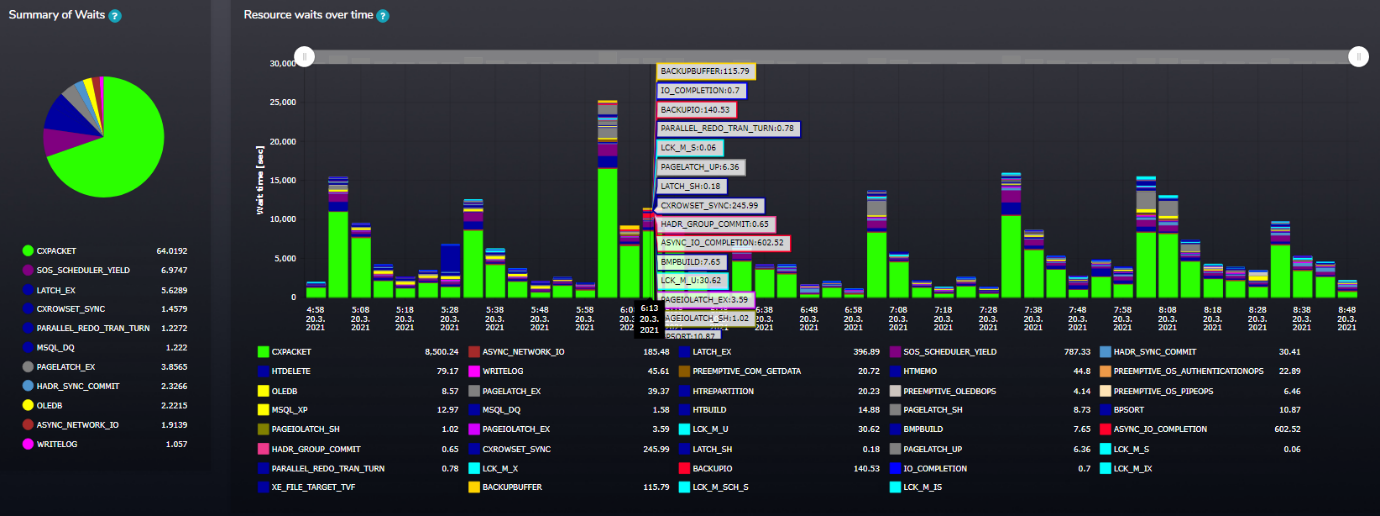
Figure 4: Summary of Resource waits and waits over time
Moving from Waits to Waiting tasks, which are shown by the next report under the same category. Collecting information about waiting tasks is more challenging as waiting tasks are a state information and in SMT we have to decide how often and how many waitings we are going to collect this type of information to not overwhelm the server. This means that not all waiting tasks are collected, but from our point of view all significant ones are present in SMT with all the related information.
Once SMT identifies a waiting task, it collects information about it to be able to provide it to user when requested. Additionally, information about waiting tasks is also used for alerts like Long Waiting tasks. One of the base information collected about the task is related waiting type. This information is available on the first chart, which is a timeline information of wait types distribution, but only from those waiting tasks collected, which passed SMT criteria for a significance. The sum of wait time from here will never match the total wait times in the previous reports.
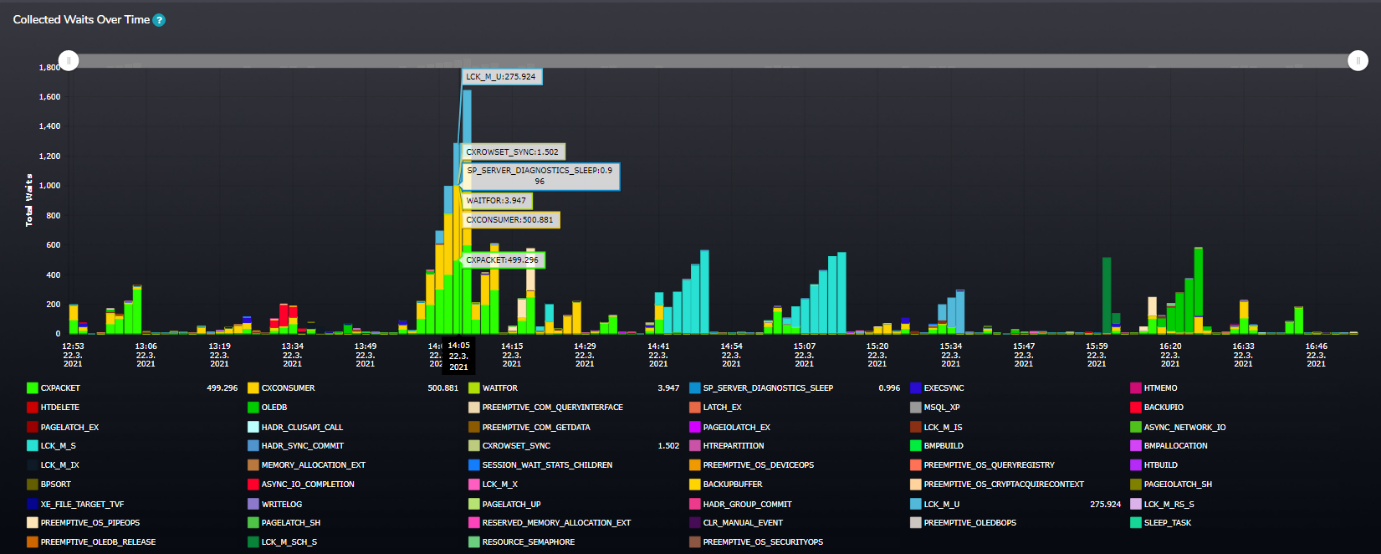
Figure 5: Wait types of Waiting tasks timeline information
This report provides one additional view and that is Waits per Database and Session. When you find a wait time peak related to an individual session you can use it to drilldown to see details about this session.
Waiting tasks analysis details returns information in a tabular form. You can either see all the sessions for the given time interval or see only session that you have identified earlier. In both cases you will see details like CPU time and duration and also details about the resource causing the waiting, you have also the option to continue with checking the query itself (text, performance metrics) or see a query plan and check if there is no plan regression for example.
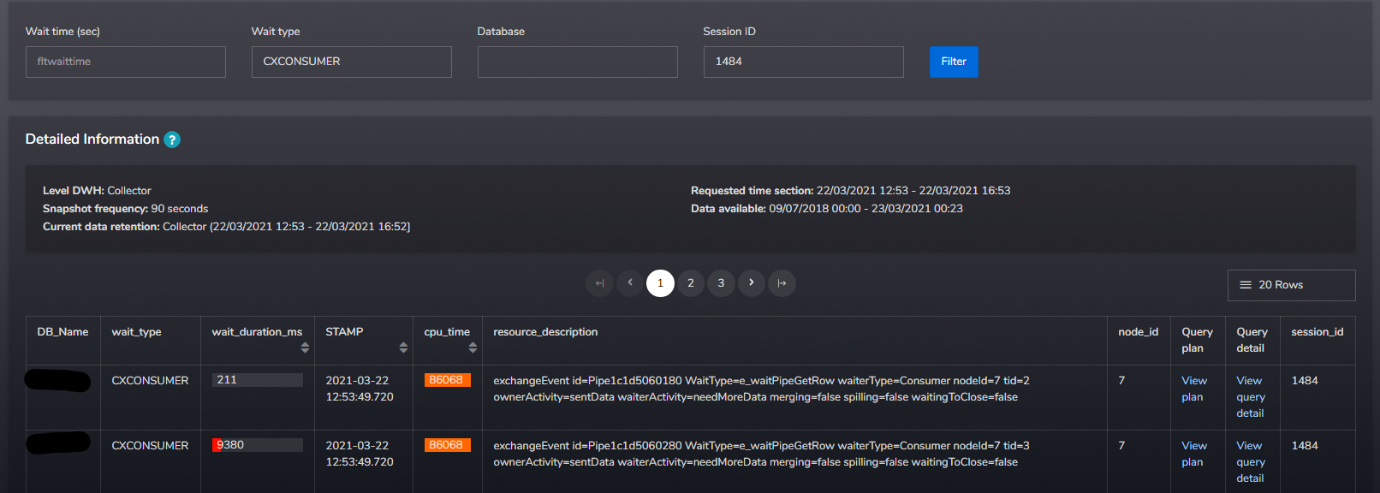
Figure 6: Waiting tasks detailed information
The last category of the reports related to Waits is “Suspended tasks” where SMT provides you with an overview of Suspended requests per database from three different angles:
- Suspended number of requests per database
- Suspended requests average wait per database
- Suspended requests total wait per database
Those reports could be handy as well for scenarios when you want to double check or find the database where most of the resource waiting is happening. Depends really on the workload on your server.
Regards,
Jiri Dolezalek