SMT 1.9 is ready
by Jiri Dolezalek on 12/05/2023What to expect from new SMT version?
Read moreRecently we had a request to optimize LATCH_EX waits on one of the production servers for our customer. Today I would like to share with you our apporach and how we handled the situation.
Let’s start with basics:
LATCH_EX is a wait related to writing to pages already in RAM (buffer pool). Usually happening heavly for suboptimal parallel operations. There might be several causes such as poorly optimized queries, oversubscribed CPU queues, etc.. you may imagine couple of other reasons.
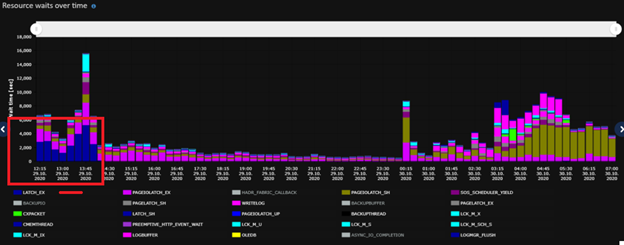
So, we went into SMT, looked at last weekend focused on highest LATCH_EX wait producers.
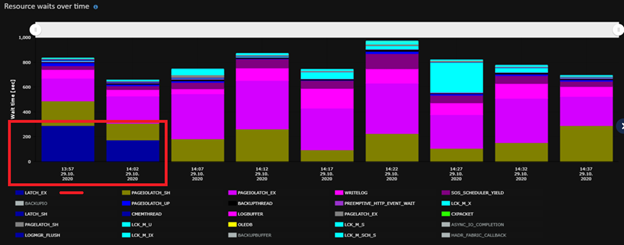
We found this (Up to 20seconds of consecutive wait for specific query):

It was a simple query:
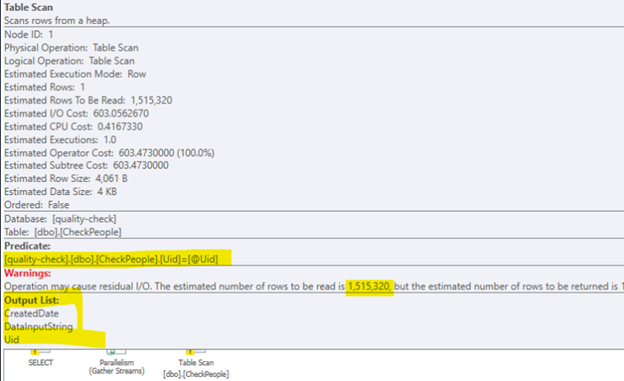
After we checked its execution plan, we found suboptimal scan operation.
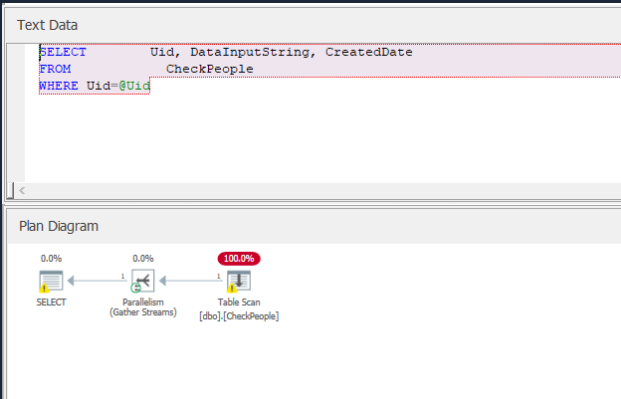
With residual operations happening.
It is clear that this type of request is selective enough to benefit from indexing. Also from plan we understand, that table is not ordered at all (HEAP). So we decided to create a clustered index.
CREATE CLUSTERED INDEX [CL_CheckPeople_UID]
ON [dbo].[CheckPeople] ([uid])
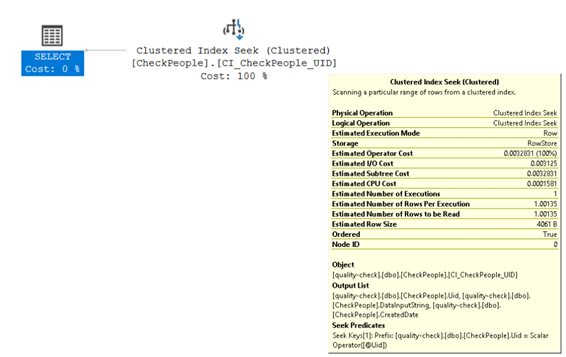
4WITH (FILLFACTOR = 80, ONLINE = ON)The final result provided much lightweights outcome for the query. Quick Index Seek - reading 1 row, returning one row.
This is how a single query - that is deployed to production untested (or tested with few 100s rows in table) can wreck your whole instance. Always check execution plans for the queries deployed to production and understand what they are doing and how are they doing it.
On the graph pbellow you may see how is our buffer pool allocated per database. Before implementation, we had 6-10GB RAM allocated for this quality-check database. After change database allocation requirements was lowered significantly.
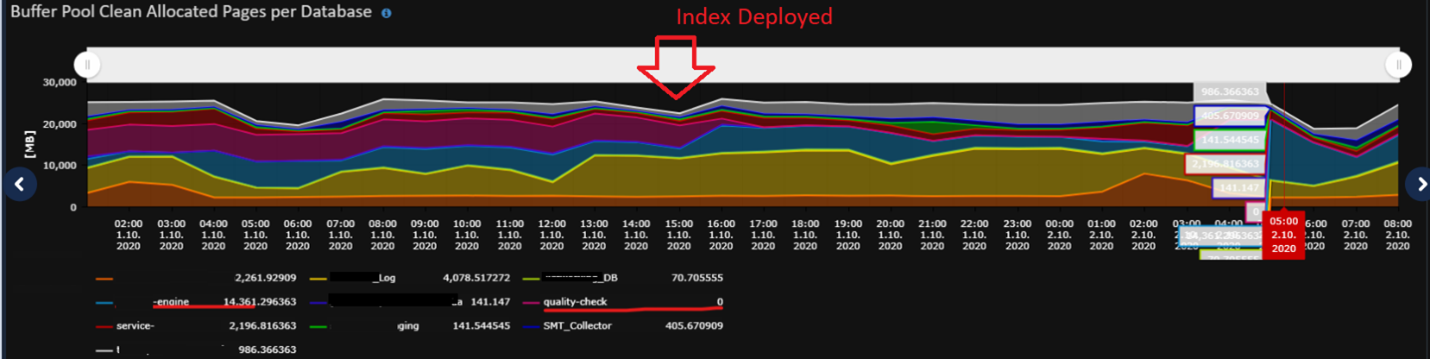
We also saw a couple of other dbs (yellow one & blue one) where we suspected similar issue.
Long story short we tuned again several top resource intensive queries from those databases.
Looked into waiting tasks and LATCH_EX filtered queries and waits, the Latch_EX went considerably down also with following tuning of _Log database.
When we fixed the majority of queries causing long LATCH_EX waits found in SMT, we focused also on parallelism configuration on the SQL Instance.
Machine was Azure MI and was using default values for MAXDOP (0) and CTFP (5).
MAX Degree Of Paralellism (MAXDOP) dictates how man threads might each operation in execution plan utilize. Cost Threshold For Paralleism (CTFP) sets threshold for executing query in parallel.
CTFP is derived from “plan cost” of a particular query - which in old days of early SQL Servers - this value should represent “price” of a query (let’s call them bucks) . Back then - single core performance was nowhere near today’s performance - and typical server had 1-2 cores. So, MS set it to 5 bucks to ensure balance between benefits (parallel execution) and negatives (overhead of redistributing and collecting work from each thread).
However – today, the single core performance is much higher, and thus outweighs the overhead that would be included. Today - these 5 bucks mean query executes in under 1 sec - whereas previously it was closer to 5 secs.
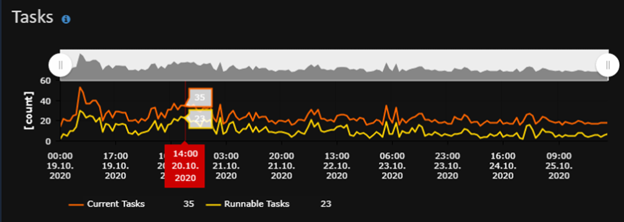
The problem is concurrency - databases are much bigger, much more complex and are queried more frequently. As a result in case your queries come in requesting 4-8 threads each for parallel operator execution - your server will “oversubscribe” CPU and you will see tasks (queries) which are waiting for assigned resource (CPU) and are held in “Runnable” state.
As you can see - in this case you have 2 options - increase CTFP to more up-to-date value or increase the amount of CPU cores that your MI has.
In none of the production servers we currently administer is the value set to 5. Depends on the workload – we usually use values from 30-60. In this case I would start with 30 and work our way from there.
This will have no impact on what data is returned from DBs - it will only impact the performance of those small-to-medium-sized queries (with cost between 0-30) will benefit, some medium queries (over 5 bucks query) may get slower by a few % .
We will monitor Wait statistics (LATCH_EX should go down along with CXPACKET - if we see high spike in SOS_SCHEDULER_YIELD then this would mean there is CPU pressure). We’ll monitor Task scheduling (SMT → CPU & Tasks → CPU Related Counters)
KPI in this case should be the TASK handling - currently in state waiting up to 23 tasks. We should see (during business hours) this to go down to 1-2 tasks.
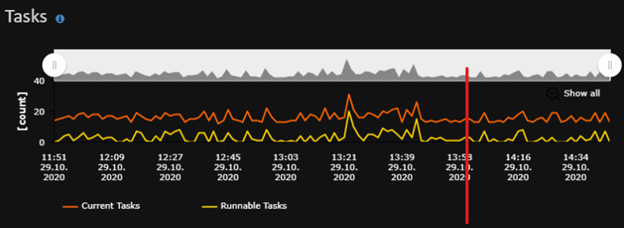
we’ve successfully eliminated last bits of the LATCH_EX wait - so now we have no more RAM waits (everything that is cached is not waiting for anything).
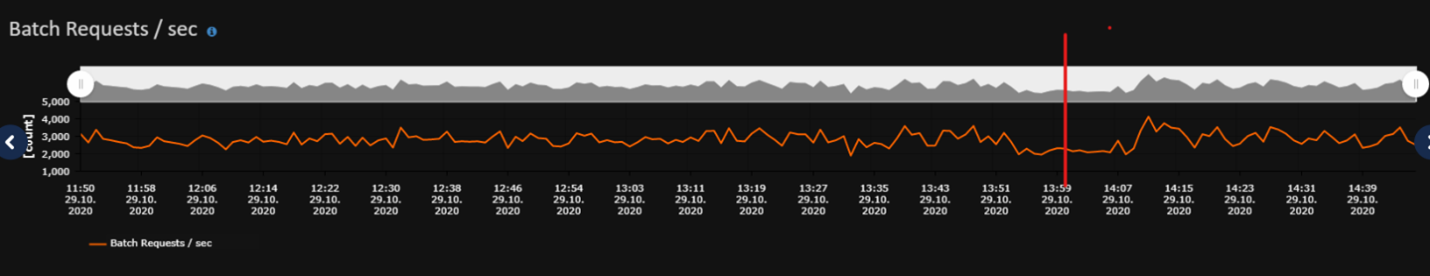
The CPU has been calm since the change - even though we’ve seen an increased throughput:

Michal is a technically proficient SQL Server Specialist with a proven track record in resolving incidents and implementing changes within large-scale database infrastructures, ensuring maximum availability of services. Concurrently, as a Digital Content and Marketing Specialist, his priority is building strong online brand identities through strategic communication and creative storytelling. He consistently seeks new ways to enhance digital interaction, believing quality digital communication is key to success in today's connected world.
Earlier this month we attended SQL Konferenz 2026, held at Congress Park Hanau, just outside Frankfurt. The venue is large and perfectly suited for conferences, which the name itself already suggests.
Read moreDear SMT users, We are glad to announce that a new version 00.6.00 is finally out.
Read more