Recently, we found an interesting pattern during exploring one of our SMT graphs while doing a health check of a SQL server. The following graph shows us the Load Factor attribute. The value came from system table sys.dm_os_schedulers, which the SMT tool periodically scans.
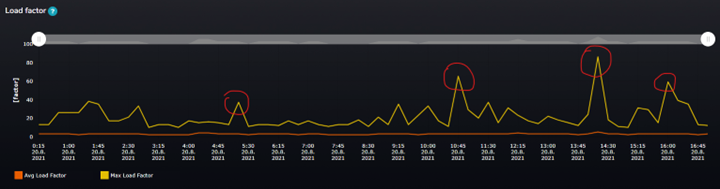
Figure 1 Load factor over the time
In the picture, you can see the orange line (Avg Load Factor) and yellow line (Max Load Factor) values over time during the business day.
Data granularity shown in this case is 15 minutes. Since the SMT collects data on predefined short snapshot intervals in the background, it calculates aggregations of the data to give users valuable information over time.
This is Microsoft’s description of what the load_factor attribute is good for.
sys.dm_os_schedulers (Transact-SQL) - SQL Server | Microsoft Docs
This value is used to determine whether a new task should be put on this scheduler or another scheduler. This value is useful for debugging purposes when it appears that schedulers are not evenly loaded. The routing decision is made based on the load on the scheduler. SQL Server also uses a load factor of nodes and schedulers to help determine the best location to acquire resources. When a task is enqueued, the load factor is increased. When a task is completed, the load factor is decreased. Using the load factors helps SQL Server OS balance the work load better.
In the picture, you can see that the Max load factor value over time reaches the range of values between 20 – 80. The average value is still in the same range, around 2 – 5. In a normal situation, these two lines (Max and Avg) should be aligned and close to each other showing us that the load over the CPU schedulers is evenly distributed over time. When we see that the Max load factor attribute reaches the value of 60 or 80 at some specific time during the day, it warns us that some of the schedulers are overloaded. Overall, the average load of all schedulers is very low, but the peaks in Max values mean that the load factor value for some schedulers was up to 80 at a specific time during that 15 minutes interval.
We went to tables of SMT tool and looked directly into table [SMT_Collector].[Activity].[Schedulers] to find exactly which of the schedulers are being overloaded
We found it! Schedulers with Ids 24 and 25, as you can see below. The load factor at the time 14:09:07 on those two schedulers was 81 respectively 83. This is not a standard value, and definitely, something is wrong.
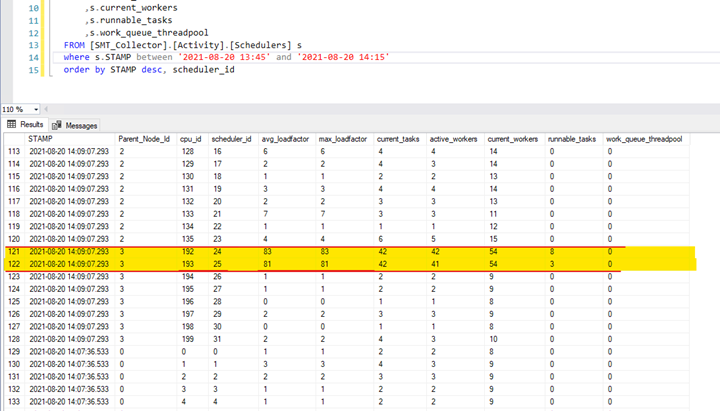
Figure 2 Raw data from table Activity.Schedulers
You can also see that 42 tasks were assigned to both schedulers, which also caused the runnable queue to grow. 84 tasks were scheduled over two schedulers/CPUs, which made huge pressure on specific CPU cores.
The same pattern we found for other business days. Always on schedulers 24 and 25.
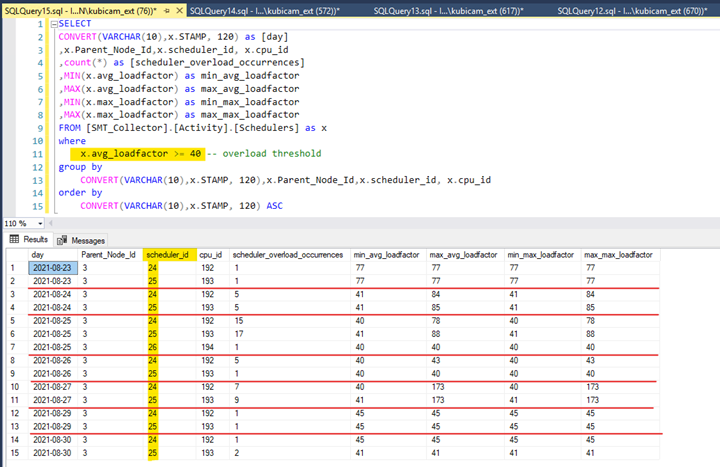
Figure 3 Raw data from table Activity.Schedulers
On 27.08.2021 – the max load factor for these two schedulers was on a critical value of 173 !!!
At that time, I also looked at other SMT graph, which shows the wait statistics collected during the time load factor reached the value of 80. The green column on the graph shows us the CXPACKET wait time – so there must be a higher number of parallel tasks running
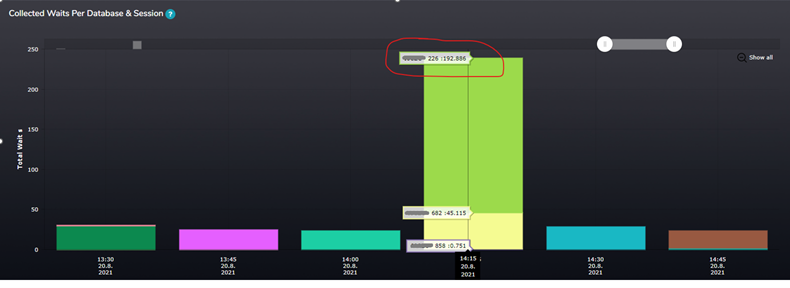
Figure 4 Waits per Database and Session
In the SMT tool, we can see particular sessions running at that time and their wait statistics over time. Session 226 was the one causing majority of all cxpacket waits.
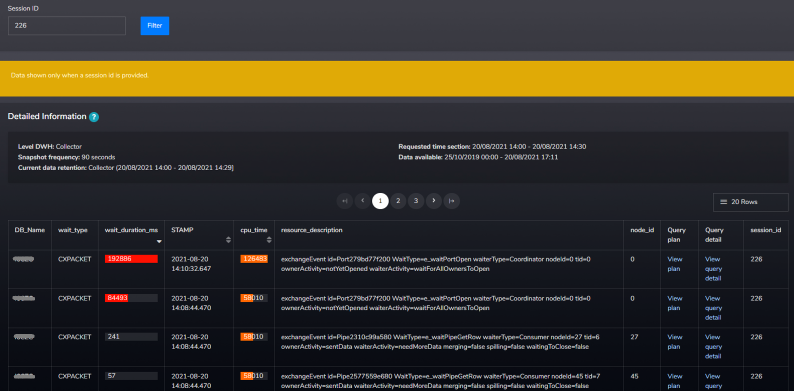
Figure 5 Waiting tasks details
So, what happened there?
From time to time query with a high number of parallel tasks comes to the instance, and SQL schedules all these tasks are placed on the same two schedulers 24,25 ?.
Why???
Customer some time ago had been using two hardware processors with 8 physical cores each, meaning 16 cores on each processor using the Hyperthreading feature. So, in the end logical server setup was 2 NUMA nodes, 16 schedulers on each NUMA node.
We got information that customer in the past wanted to dedicate 6 schedulers (26-31) for the specific application (for whatever reasons) and the rest of the schedulers (0-25) for the rest of the load. They were using SQL resource governor to set it up.
I really like resource governor as you (DBA) are able to control how server resources are being allocated to specific load on your server, especially when you are running a SQL Server hosting many databases used by different types of applications and you have to ensure they have resources they need.
You may found this non-default configuration by querying the system table sys.dm_resource_governor_resource_pool_affinity to get this information. Be aware, that information about non-default resource pool affinity setup is not shown when you check it via GUI in the management studio, and you have to query it.
This was the setup that had been applied since previous hardware was used.
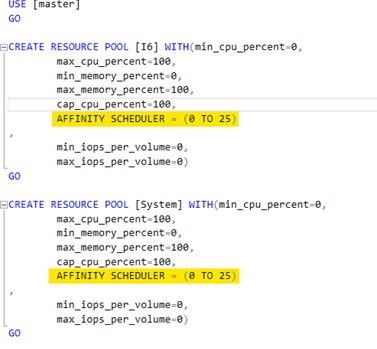
Figure 6 TSQL script to create resource pool with non-default affinity configuration
The screenshot of the specific application resource group is missing, but its setup was like this one:
AFFINITY SCHEDULER = (26 TO 31)
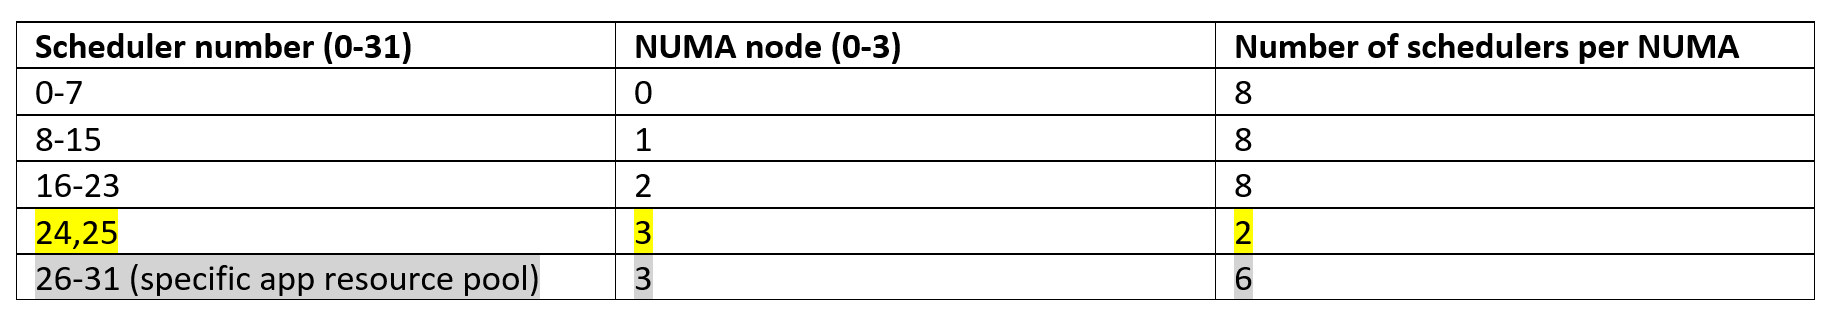
Later, customer updated their processor and migrated to a new setup - 2 sockets with 2 NUMA nodes per socket. Each NUMA node contains 4 physical cores (8 hyperthreaded cores).
So the setup was 4 NUMA nodes with 8 schedulers on each NUMA node.
Based on the current setup of resource pool scheduler affinity, we are getting the following 4 groups of schedulers:
What caused the issue with overloading some of the schedulers?
SQL Server is smart enough to schedule its tasks to try to avoid cross-NUMA scheduling. When schedulers 0-23 were busy at that time, and schedulers 26-31 were dedicated for specific resource pool, SQL decided to allocate parent task of the session to scheduler number 24 or 25 and then generated 84 tasks to deliver the data for this query. Since the parent task was assigned on scheduler 24 (25) on NUMA node 3 and the rest of the schedulers on this NUMA node were dedicated to the specific resource pool, it placed all these child tasks on the schedulers 24 and 25 within the same NUMA node 3 – yes, 84 child tasks on 2 schedulers (exactly what we have seen on previous screenshots).
Do we still need it?
Based on those findings and consultations with the customer that specific application resource pool and its dedicated schedulers are not needed anymore, we have updated resource pools configuration and changed the affinity scheduler attribute of resource pools back to the default value - AUTO.
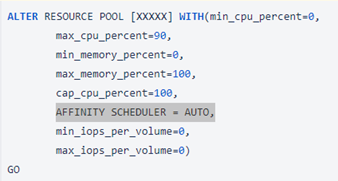
Figure 7 TSQL script to alter resource pool with affinity scheduler AUTO
In the case customer still wants their dedicated pool with a specific affinity, a different approach could be chosen there.
After this change, the load factor value over time has lowered to reasonable values. The highest peak of max load reached a value 35 on 1-hour granularity during the business week. Overall the values during the time are in a range of standard server load.
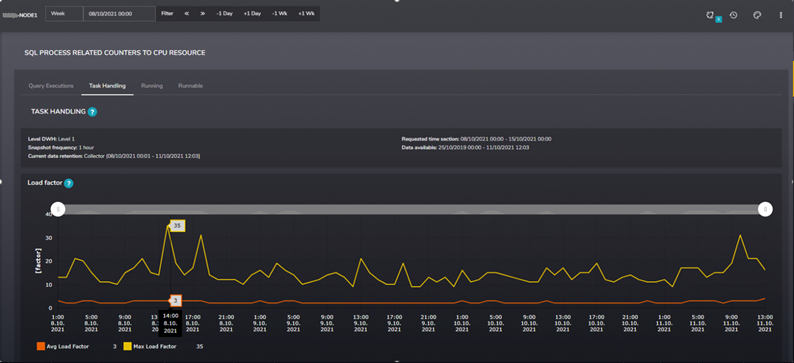
Figure 8 Load Factor after affinity scheduler change
Conclusion
Playing with this kind of configuration can be very dangerous if not executed wisely. There should always be a good reason to edit the default server configuration in this manner. These kinds of configurations need to be documented and known to administrators. DBA should have a reason, and some proof of concept that modifying such attributes makes sense and does not affect the performance of the rest of the server load. Also, after some time, admins need to reevaluate if the situation on the server still requires such a configuration.
Anyway, if it happens, we still have tools to find and solve various problems like using our SMT.